Measurement of Central Tendency - Mean (Using R)
A free video tutorial from Sandeep Kumar Quality Gurus Inc.
Experienced Quality Director • Six Sigma Coach • Consultant
65 courses
351,689 students
Learn more from the full course
Statistics for Data Analysis Using R
Learn Programming in R & R Studio • Descriptive, Inferential Statistics • Plots for Data Visualization • Data Science
12:24:19 of on-demand video • Updated June 2026
Learn R programming from the ground up, starting from the basics and progressing to advanced data analysis techniques.
Learn the basic statistical concepts first, followed by practical application using R Studio, combining theory and practice for effective learning.
Master descriptive statistics, including mean, mode, median, skewness, and kurtosis, and how to apply these concepts to your data analysis.
Understand and perform inferential statistics such as one and two-sample z-tests, t-tests, Chi-Square tests, F-tests, ANOVA, and TukeyHSD, and more.
Explore probability distributions, including normal, binomial, and Poisson, and their applications in data analysis.
Develop the skills to perform data manipulation, visualization, and statistical analysis using R.
Apply statistical concepts in real-world scenarios, enhancing your problem-solving abilities and decision-making skills.
Boost your career prospects with a strong foundation in statistics and R programming, valuable skills in today’s data-driven job market.
Equip yourself with the tools to handle large datasets and perform complex statistical analyses with confidence.
Enhance your ability to make data-driven decisions by mastering the use of R for statistical analysis.
English
Now coming back to Measurement
of ‘Central Tendency’. The first Measurement of Central Tendency is the ‘Mean’.
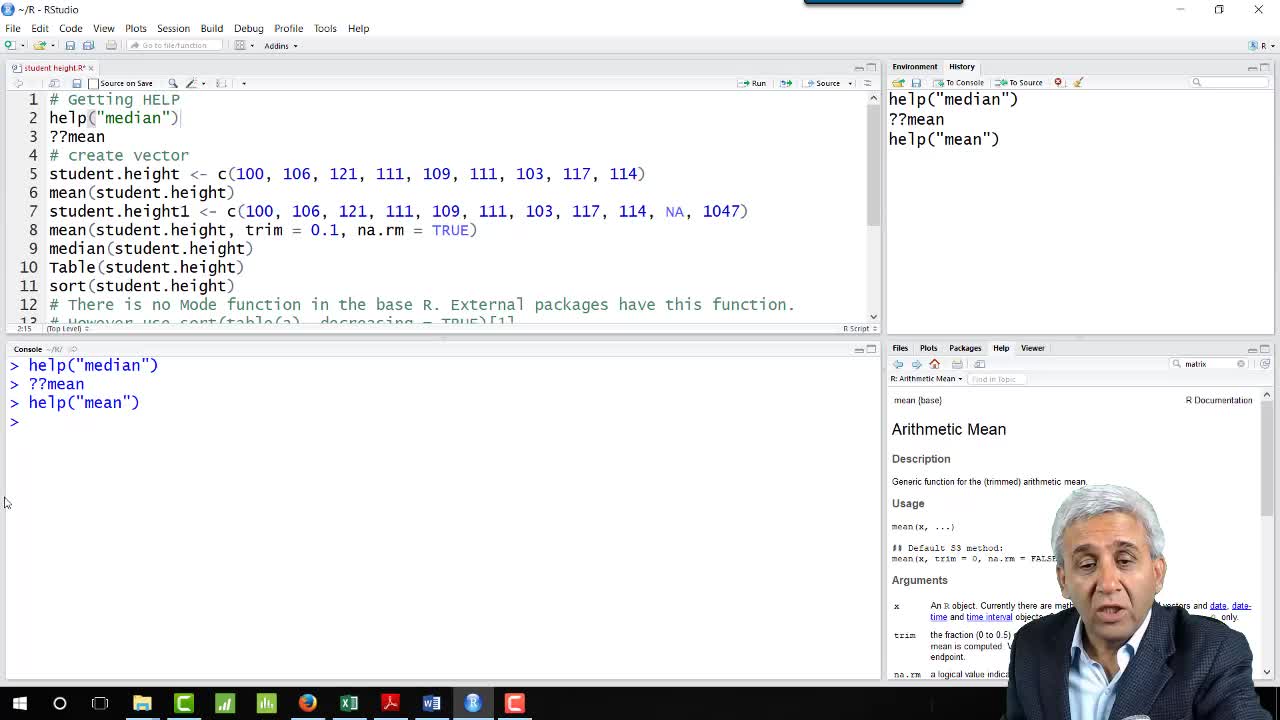
And how do we find out ‘Mean’? Before we find out ‘Mean’ let's put some data here,
so I have put data here. This data is related to student height. Either I can copy this,
let's say if I can copy this and paste it here and press enter. Now what happened is in the vector named as
‘student.height’ these particular heights have been added. So if I know if I put student
height and once I'm half way down, I can just press tab to fill it and then enter. So this gives
me that in this particular vector these are the numbers. So the other things I can do is in the script window itself I can
select the particular line and I can press control and enter. So this also will do the same thing. So now I have student height and now I need to
find out ‘mean’ of all these student heights, so for that, I can use the function, which is ‘mean’, and I can type
here ‘mean’ and in the bracket now, I can put ‘student height’. Now if you are wondering that should I be putting
the inverted comma’s here let's say like this. No, you don't need to put inverted commas here because now student
height is a vector. It's a name in which you have all your data. You need to put inverted commas when you're
putting something called as character. ‘student.height’ is not a
character, it is a vector in which you have all this information. So for this you don't need
to put a single quote or double quote you don't need to put that. So now for Mean what I what I've done is
‘mean’ and in the bracket I put student height and with this if I press enter this will
give me the ‘mean’ of all student heights. So ‘mean’ is 110.2222. And if you see environment here, in environment the student.
height has been saved as a vector. Here I have added nine students height. But what happens number of times you will have
this information which will be a large number in an excel sheet, which you'll be importing
here in R and you'll be working on that. When you are importing excel file, having a lot of students height, let’s
say 1000 students height one or two of those might not have height. So these might be blank fields, anything which
is blank when imported to R, becomes and na now question comes that when calculating ‘mean’
should 'na' be counted as a Number are not. So to understand that let's take this one. This is a student.height 1. So now in this new vector, which is student.height
1 we have nine items, which we had earlier but in addition to that, we have 'na' as
a 10th item and 1047 as the 11th item. 'na' is not available so the height of 10 students was not available and
11 student height is mentioned as 1047 which seems to be a mistake. Now what do we do about 'na'? Now if I want to find out
the ‘mean’ of student.height 1. So I will type ‘mean’ student height 1 and if I
press enter this gives me 'na'. So now, I need to find a way
to remove 'na' from this list. This list again I'm saying is a small list but let's say,
once you have 10000 students and the height of those many of these might be missing field. And once
these are important to R those becomes 'na', so you need to take care of those NAs
when you have the large number of data. So let's see what you need to do to remove NAs from that list.
So this is something which I did earlier student height. But here if I put 'na'.rm
which comes here = true that means remove Na’s from the list. And with this parameter if I press enter now
''na'' will be removed from these 11 numbers and we will be left with these 10 numbers 9 old numbers, + 1047 which
was the last number. And with this, I find the ‘mean’ as 203.9. Now another problem remains here is that this
height is too much because of some extreme value and that extreme value is 1047. ‘Mean’ function in R gives you that facility where you can remove
extreme values because extreme values can affect the ‘mean’. This is student height. Maybe if you are looking at the income of people
and 1 person 2 person, which have come in the group as a very high income, you want to remove those people from the group to find out the ‘mean’
so that you can really make a good representation of the people that ‘mean’ should not be affected by those extreme values.
So what you can do is you can trim this data. When I said trim this data you can remove let's say 10% of the
top values and 10% of the bottom values if you want to remove then you can use trim
function and add trim = 0.1. So point 1 ‘mean’ s 10% from the top will be
removed and 10% from the bottom will be removed. So let's do that. And here let's keep that na.rm = true and in addition to
that I add ‘trim =0.1’ and 0.1 is 10% from the top 10% from the bottom. And I hope with that 1047 we'll
get removed from the list. Let's see. And now here I get 111.9. 111.9 is something similar to 110 because from the top 1047 has been removed and from the bottom which
was the lowest one of which was 100. So that also has been removed. So with that instead of these nine numbers now you are left with
these eight numbers, the average of these eight numbers is 111.5. So this was all about the ‘mean’ where you can
find the ‘mean’ where you can do the trimming. Trim Mean and you can remove the
'Na’s from the group of data.